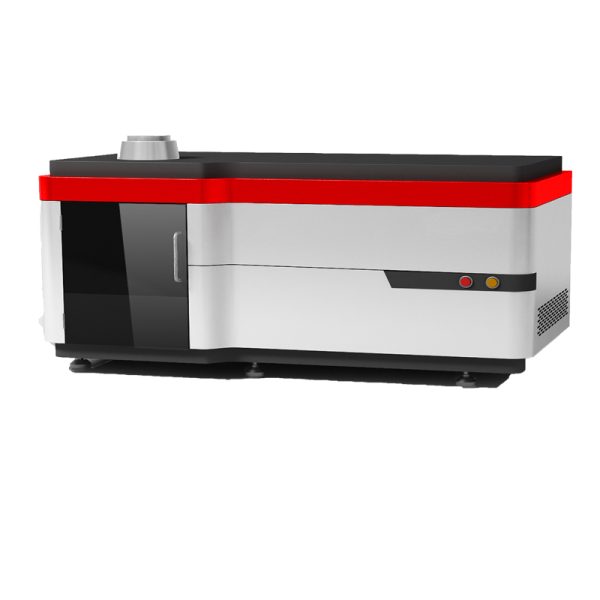


GA-188 Optical Emission Spectrometer

- Description
- Inquiry
Description
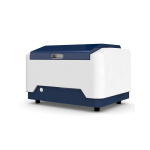
GA-188 Optical Emission Spectrometer
1.Working principle and application
GA-188 full-spectrum direct reading spectrometer consists of excitation module, optical system, measurement and control system and analysis software. When the instrument works, under the protection of argon, the high voltage discharge generated by the excitation light source transfers the energy to the metal material, making the metal material change from solid to gaseous state. The electrons in the outer shell of an atom of gold vapor transition from the ground state to an excited state. The excited atom is unstable. When the electrons in the outer shell return to the ground state, energy is emitted as light. Different elements emit light of different wavelengths, and the full spectrum curve is collected through the optical path system and CMOS detector. The spectrum is solved by the analysis software, and the existence of an element is confirmed according to the wavelength of light, and the content of this element is determined according to the intensity of the wavelength.
GA-188 full-spectrum direct reading spectrometer is mainly used to measure the alloying element composition and impurity element content in metal materials, widely used in metallurgy, casting, machining and other industries of pre-furnace inspection, incoming inspection, quality control and delivery inspection.
The measuring accuracy of GA-188 full-spectrum direct reading spectrometer is far higher than the national standard, reaching the highest grade A, which can be verified by national metrological institutions. Since its launch, it has accumulated rich application experience and been recognized by many well-known customers.
GA-188 Optical Emission Spectrometer
2.Main technical parameters
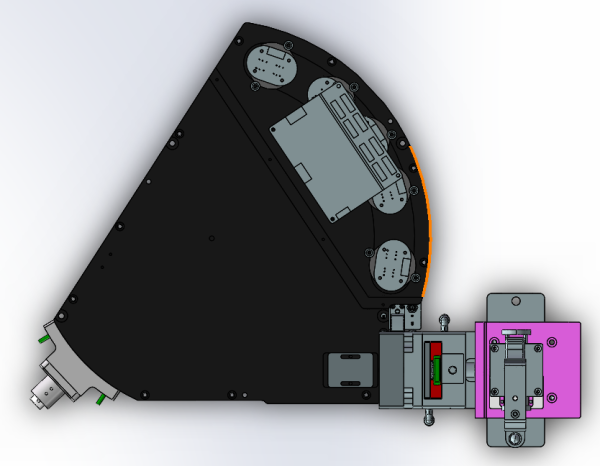
▞ Optical structure: GA-188 the Paschen-Runge structure, Rowland circle device, in order to reduce the instrument change with environment temperature and the influence of the stress release caused by, improve the instruments accuracy and stability.
▞ Optical focal length: the grating radius of 401 mm, the longer the focal length for the instrument provides excellent resolution.
▞ Spectral range: detectable wavelength range (165 ~ 580 nm), to analyze a variety of conventional elements, meet the needs of various substrate material elements of the test.
▞ Incident: slit slit width 12 microns, fine incident slit effectively filter out unwanted noise light, avoid detector light intensity is too saturated, reduces light interference between elements.
▞ Detector: Using CMOS detector, the installation of more than CMOS, using dislocation layout, there is no gap between different wavelengths, wavelength light spectrum as a whole, to achieve full spectrum coverage, meet customer demand for multielement test.
▞ Concave grating: 2400 gr/mm, bottom: dispersion rate (grade 1) 0.47 nm/mm, concave grating can reduce absorption phenomenon, there are only a grating surface reflected light loss, and no color difference, the effect of vacuum ultraviolet spectra of ascension.
▞ Analysis time: according to the different types of samples and, general analysis took less than 40 seconds at a time. Ø
▞ Excitation light source, digital excitation light source, a variety of adjustable excitation conditions, meet the demand of the analysis of the different materials.
▞ Excitation electrodes: using high purity tungsten electrodes, high purity tungsten electrode has advantages of high strength, corrosion resistance, resistance to high temperature oxidation, reduce instrument made in the process of instrument parameters effect on the test data.
▞ Argon modules: argon purity 99.999%, argon gas inlet pressure 0.5 MPa, argon gas flow excitation flow is about 3.5 L/min, maintain flow is about 0.4 L/min, the standby flow is about 0.1 L/min.
▞ Size and weight: 620 * 495 * 270 mm, about 40 kg
GA-188 Optical Emission Spectrometer
3.Main technical features
Argon circulation
▞ Excellent optical purity of argon sealing performance can keep for a long period of time.
▞ Advanced argon purging optical element, optimize the performance of the UV components.
▞ Argon circulation filter can eliminate air molecules, improve the reliability of the optical system.
▞ Optics instrument can avoid optical drift and improve the stability of the pressure of long-term stability.
▞ Low argon consumption and economic efficiency.
CMOS full spectrum analysis technology
▞ Rich spectrum, better accuracy analysis.
▞ Full spectrum to distinguish the background and improve the analysis accuracy.
▞ Sensitive intelligence to choose the appropriate wavelength, the application of multispectral fitting technology, the content of general value has outstanding performance.
▞ Multispectral fitting technology to eliminate the influence of the spectrum, to achieve the precise measurement.
The original real-time intelligent drift correction technique
▞ Analysis of real-time spectrum drift correction, to improve the stability of the instrument.
▞ Automatic calibration, easier to operate. Reduce the standardization frequency.
Patent design of pneumatic valve block
▞ Will multiplex solenoid valve and pressure control integration, namely, reduced volume, and can reduce the failure rate.
▞ Light room filled argon circulation system with excitation, saving the argon gas consumption.
Professional and simplify the operating software
▞ Bots
Intelligent selection of matching programs for more accurate analysis results
Enable quantitative analysis of unknown samples.
▞ Quality control
Easily set upper and lower limits according to the user’s quality standards.
Automatically determine whether the sample component passes.
▞ Level identification
Quickly identify sample grades and easily classify unknown materials.
▞ Automatic diagnosis system
Software interface indicates real-time instrument operation status.
Warning instrument maintenance and cleaning time.
One-click operation
One-button operation, quick and easy operation, adjust according to factory requirements.
4. Laboratory environment requirements
Environmental requirements
▞ Instrument must be placed in a special laboratory, indoor area of more than 10 square meters, around and make sure that no hazardous, flammable and corrosive gases. Note: It is forbidden to place the instrument in the chemical analysis laboratory.
▞ Working temperature: 10℃ ~ 30℃, 3 hours at room temperature fluctuation is less than 2℃, the installation of air-conditioning requirements lab.
▞ Storage temperature: 0℃ ~ 45℃
▞ Environmental relative humidity: 20% ~ 80%, and for wet regions, should be equipped with a QuShiJi.
▞ Direct reading spectrometer spectral chamber installed in the casing with temperature control device, can in the environment within the scope of work, if beyond the scope of the above requirements, the service life of the instrument and the measurement accuracy will be affected.
Power requirement
▞ Power single-phase 220 + 20 v, 1 kva power supply.
▞ In order to guarantee the normal use of the direct reading spectrometer, please for instrument equipped with a 1 kva ~ 3 kva single-phase 220 v ac voltage regulator parameters.
▞ Direct reading spectrometer using the protective earthing of single-phase power supply. To ensure reliable use of the device, users must ensure that the PE protection ground of the power grid is well grounded and separated from the protection ground of other large equipment. If the PE cannot be properly grounded, prepare a ground wire for the device with a ground resistance less than 4 ohms.
Argon requirement
▞ Argon purity 99.999% or higher, 2 PPM or less oxygen and H2O content 5 PPM, or less (argon bottle in the open air, not rain) are strictly prohibited. If high purity argon is not available, argon purifier is recommended.
▞ Argon flow of use: standby flow is about 0.1 L/min, maintain traffic about L/min (0.4 to 0.5), stimulates the flow of about 3.5 L/min.
▞ Argon control pressure: 0.5 Mpa.
Argon connecting tube
▞ Random special argon stainless steel pipe connection must be used.
Exhaust bottle
▞ Exhaust gases from the instrument by a 14 mm diameter PVC reinforced tube row to provide filtering in the bottle. Need to be cleaned and replaced in time to prevent the ventilation.
Sample preparation
▞ For iron base must use special grinding prototype sample preparation of samples, a double disc grinding prototype and a floor grinding machine, used for polishing on the surface of the steel sample. Non-ferrous metals require a small lathe for sample preparation.
▞ Users need to prepare a cutting machine, used for exterior is not suitable for processing the sample of the spectrometer analysis;
▞ Are analyzed samples must be uniform, no pores, no casting defects, preparation must achieve the surface smooth, without oxidation layer, without oil, the sample edge, no burr.
Standard sample requirements
▞ Direct reading spectrometer factory will randomly throw in a spectral calibration standard sample, used for calibration of the instrument as a whole spectrum drift. In addition, users should prepare standard samples or internal control samples suitable for their product types for calibration of instrumental analysis curves.
PC and printer requirements
▞ Prepare a current general configuration of PC (laptop and desktop), requires more than 1 gb of memory, more than 1.8 GHZ dual-core CPU, used to install the direct reading spectrometer analysis software.
▞ Prepare a printer, laser and inkjet or stylus printer, print used to analyze the data report.
Some of the matrix elements and their ranges for instrumental analysis (see table of matrix elements separately)
| Analytical curve | Middle-low alloy steel | Cr-Ni stainless steel | Cr stainless steel | |||||
| element | Min | Max | Min | Max | Min | Max | ||
| C | 0.0006 | 1.3 | 0.008 | 2.5 | 0.04 | 2.2 | ||
| Si | 0.01 | 3.9 | 0.09 | 4 | 0.1 | 1.4 | ||
| Mn | 0.03 | 2.1 | 0.12 | 16 | 0.1 | 1.5 | ||
| P | 0.002 | 0.12 | 0.003 | 0.3 | 0.006 | 0.05 | ||
| S | 0.002 | 0.16 | 0.001 | 0.4 | 0.001 | 0.3 | ||
| Cr | 0.01 | 4.5 | 7.4 | 32 | 7.8 | 24 | ||
| Ni | 0.004 | 4.4 | 0.8 | 48 | 0.09 | 4.2 | ||
| Mo | 0.0004 | 1.3 | 0.08 | 4.2 | 0.02 | 1 | ||
| Al | 0.003 | 1.5 | 0.005 | 1.7 | 0.1 | 1.7 | ||
| Cu | 0.0002 | 0.5 | 0.05 | 4.5 | 0.02 | 0.5 | ||
| Co | 0.001 | 0.5 | 0.008 | 17 | 0.01 | 0.5 | ||
| Ti | 0.002 | 1.2 | 0.005 | 1.1 | 0.006 | 0.4 | ||
| Nb | 0.002 | 0.3 | 0.02 | 2 | ||||
| V | 0.0003 | 0.9 | 0.02 | 9.5 | 0.03 | 1.1 | ||
| W | 0.03 | 2.1 | 0.002 | 4.1 | 0.05 | 0.7 | ||
| Pb | 0.0003 | 0.03 | 0.0001 | 0.02 | ||||
| B | 0.0006 | 0.02 | 0.0007 | 0.02 | ||||
| Sn | 0.001 | 0.09 | 0.0003 | 0.05 | ||||
| Zn | 0.002 | 0.04 | 0.006 | 0.008 | ||||
| As | 0.0007 | 0.1 | 0.0004 | 0.04 | ||||
| Bi | 0.0001 | 0.01 | 0.00004 | 0.003 | ||||
| Zr | 0.004 | 0.35 | ||||||
| Ca | 0.0004 | 0.002 | 0.0003 | 0.001 | ||||
| Sb | 0.0002 | 0.02 | 0.0005 | 0.022 | ||||
| Fe | Balance | Balance | Balance | |||||
| Analytical curve | Cast iron | High-chromium iron | High manganese steel | Chisel tool steel | ||||
| Element | Min | Max | Min | Max | Min | Max | Min | Max |
| C | 1.8 | 4.5 | 0.9 | 3.4 | 0.5 | 2.4 | 0.08 | 2.2 |
| Si | 0.2 | 4.7 | 0.2 | 2.5 | 0.3 | 1.7 | 0.04 | 1.5 |
| Mn | 0.06 | 4.7 | 0.1 | 2.4 | 5.3 | 23 | 0.04 | 1.7 |
| P | 0.02 | 0.8 | 0.01 | 0.3 | 0.01 | 0.2 | 0.004 | 0.07 |
| S | 0.003 | 0.2 | 0.01 | 0.15 | 0.006 | 0.11 | 0.001 | 0.06 |
| Cr | 0.03 | 10.5 | 0.4 | 34 | 0.08 | 3.8 | 1.8 | 14 |
| Ni | 0.05 | 6.8 | 0.05 | 32 | 0.04 | 3.5 | 0.07 | 0.55 |
| Mo | 0.01 | 2.1 | 0.1 | 4 | 0.1 | 2 | 0.02 | 9.4 |
| Al | 0.002 | 0.12 | 0.008 | 0.12 | 0.005 | 1.6 | ||
| Cu | 0.06 | 2.2 | 0.06 | 1.5 | 0.02 | 0.6 | 0.04 | 0.5 |
| Co | 0.008 | 0.03 | 0.007 | 0.1 | 0.008 | 8 | ||
| Ti | 0.007 | 1 | 0.01 | 0.14 | 0.004 | 0.4 | ||
| Nb | 0.002 | 0.7 | 0.1 | 0.7 | 0.08 | 0.42 | ||
| V | 0.01 | 0.7 | 0.02 | 1.2 | 0.01 | 0.84 | 0.03 | 2.5 |
| W | 0.007 | 1 | 0.06 | 19 | ||||
| Pb | 0.0002 | 0.04 | 0.0001 | 0.07 | ||||
| Mg | 0.001 | 0.14 | ||||||
| B | 0.002 | 0.5 | 0.0009 | 0.02 | ||||
| Sn | 0.003 | 0.3 | 0.008 | 0.07 | 0.007 | 0.05 | ||
| Fe | Balance | Balance | Balance | Balance | ||||
| Analytical curve | Aluminium-silicon | Aluminium and zinc | Aluminum bronze | Aluminum and magnesium | Pure aluminium | |||||
| Element | Min | Max | Min | Max | Min | Max | Min | Max | Min | Max |
| Si | 0.02 | 24 | 0.02 | 9.4 | 0.02 | 7 | 0.02 | 2.3 | 0.01 | 1.2 |
| Fe | 0.02 | 4 | 0.03 | 1 | 0.05 | 1.9 | 0.07 | 0.8 | 0.01 | 4 |
| Cu | 0.005 | 6 | 0.01 | 4.3 | 0.01 | 13 | 0.007 | 1 | 0.002 | 1 |
| Mn | 0.005 | 1 | 0.02 | 1 | 0.05 | 1 | 0.03 | 2.4 | 0.001 | 1 |
| Mg | 0.01 | 1.5 | 0.01 | 4 | 0.01 | 2.7 | 0.006 | 10.2 | 0.002 | 1 |
| Cr | 0.005 | 0.5 | 0.01 | 0.4 | 0.01 | 0.14 | 0.01 | 0.4 | 0.001 | 0.15 |
| Ni | 0.02 | 2.5 | 0.01 | 0.2 | 0.01 | 2.3 | 0.005 | 0.25 | 0.001 | 0.16 |
| Zn | 0.005 | 3.5 | 0.01 | 12 | 0.05 | 3.5 | 0.01 | 1 | 0.002 | 0.5 |
| Ti | 0.005 | 0.4 | 0.005 | 0.3 | 0.001 | 0.2 | 0.007 | 0.3 | 0.001 | 0.15 |
| Bi | 0.02 | 0.6 | 0.002 | 0.6 | 0.02 | 0.6 | 0.02 | 0.6 | 0.02 | 0.6 |
| Cd | 0.001 | 0.3 | 0.002 | 0.3 | 0.01 | 0.3 | 0.01 | 0.3 | 0.001 | 0.3 |
| Co | 0.003 | 0.4 | 0.01 | 0.05 | 0.03 | 0.4 | 0.03 | 0.4 | 0.009 | 0.4 |
| Ga | 0.005 | 0.2 | 0.009 | 0.02 | 0.002 | 0.06 | ||||
| Pb | 0.005 | 0.5 | 0.005 | 0.5 | 0.01 | 0.5 | 0.001 | 0.5 | 0.002 | 0.5 |
| Sb | 0.005 | 0.4 | 0.1 | 0.4 | ||||||
| Sn | 0.003 | 0.5 | 0.005 | 0.2 | 0.02 | 0.3 | 0.001 | 0.2 | 0.01 | 0.2 |
| V | 0.005 | 0.2 | 0.005 | 0.03 | 0.01 | 0.03 | 0.002 | 0.03 | 0.004 | 0.05 |
| Zr | 0.005 | 0.2 | 0.01 | 0.3 | 0.001 | 0.2 | 0.003 | 0.12 | 0.001 | 0.12 |
| Al | Balance | Balance | Balance | Balance | Balance | |||||
| Analytical curve | Brass
|
White copper + zinc white copper | Aluminium bronze
|
Tin-lead bronze | ||||
| Element | Min | Max | Min | Max | Min | Max | Min | Max |
| Zn | 0.5 | 45 | 0.01 | 0.8 | 0.04 | 7 | 0.003 | 11.3 |
| Zn | 18 | 33.5 | ||||||
| Pb | 0.01 | 6 | 0.002 | 1.3 | 0.002 | 0.12 | 0.001 | 21 |
| Sn | 0.009 | 9.5 | 0.009 | 5.8 | 0.003 | 2.5 | 0.005 | 19 |
| P | 0.002 | 0.2 | 0.003 | 0.07 | 0.002 | 0.2 | 0.001 | 1 |
| Mn | 0.001 | 5.3 | 0.0009 | 1.8 | 0.001 | 2.4 | 0.001 | 0.4 |
| Fe | 0.02 | 3 | 0.03 | 2.7 | 0.005 | 6 | 0.003 | 1 |
| Ni | 0.009 | 1.8 | 5.5 | 34 | 0.002 | 6 | 0.001 | 5 |
| Si | 0.001 | 4.6 | 0.0009 | 0.8 | 0.004 | 0.3 | 0.002 | 1.4 |
| Mg | 0.001 | 0.01 | 0.003 | 0.7 | ||||
| Cr | 0.001 | 0.2 | 0.0003 | 1.8 | ||||
| As | 0.001 | 0.2 | 0.003 | 0.05 | 0.001 | 0.03 | 0.004 | 0.2 |
| Sb | 0.001 | 0.4 | 0.001 | 0.1 | 0.001 | 0.6 | ||
| Cd | 0.001 | 0.02 | 0.001 | 0.01 | ||||
| Bi | 0.002 | 5.5 | 0.001 | 0.1 | 0.002 | 0.12 | 0.006 | 1 |
| Ag | 0.007 | 0.1 | 0.002 | 0.1 | 0.001 | 0.06 | ||
| Co | 0.004 | 0.5 | 0.007 | 0.3 | 0.001 | 0.2 | ||
| Al | 0.001 | 6.7 | 0.0009 | 2 | 3.0 | 12 | 0.01 | 0.6 |
| Cu | Balance | Balance | Balance | Balance | ||||
| Analytical curve | Red copper
|
Beryllium bronze
|
Silicon bronze
|
|||
| Element | Min | Max | Min | Max | Min | Max |
| Zn | 0.001 | 0.3 | 0.005 | 0.23 | 0.2 | 6 |
| Pb | 0.001 | 1.5 | 0.005 | 0.3 | 0.01 | 0.8 |
| Sn | 0.001 | 0.3 | 0.005 | 0.18 | 0.05 | 0.7 |
| P | 0.001 | 0.02 | 0.005 | 0.08 | ||
| Mn | 0.0001 | 0.1 | 0.005 | 0.08 | 0.2 | 1.8 |
| Fe | 0.001 | 0.2 | 0.02 | 0.28 | 0.1 | 1.7 |
| Ni | 0.001 | 0.5 | 0.005 | 0.35 | 0.05 | 1 |
| Si | 0.02 | 0.3 | 1.5 | 5 | ||
| Mg | 0.001 | 0.01 | 0.002 | 0.01 | ||
| Cr | 0.001 | 0.03 | 0.002 | 0.006 | ||
| Te | 0.005 | 0.05 | ||||
| As | 0.005 | 0.3 | 0.005 | 0.08 | ||
| Sb | 0.005 | 0.35 | 0.005 | 0.07 | ||
| Cd | 0.001 | 0.03 | ||||
| Bi | 0.001 | 0.07 | 0.002 | 0.02 | ||
| Be | 0.32 | 3.2 | ||||
| Co | 0.001 | 0.05 | 0.15 | 2 | ||
| Al | 0.002 | 0.02 | 0.02 | 0.2 | 0.02 | 0.35 |
| S | 0.001 | 0.05 | 0.005 | 0.02 | ||
| Cu | Balance | Balance | Balance | |||